Fig. 8
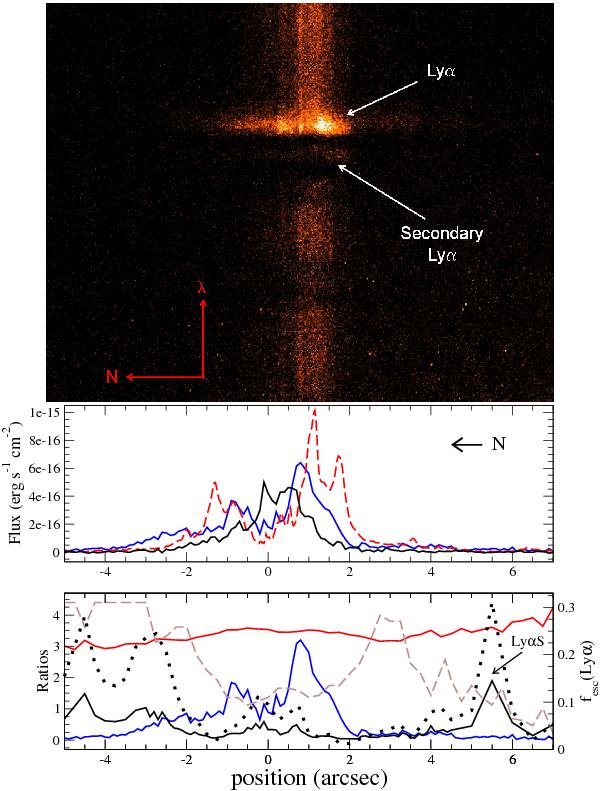
Top: HST/STIS G140M spectral image of IRAS 0833. Spatial extension is ~ 19″ (~7.5 kpc) . Middle: emission profile of the main component of Lyα (blue) and UV continuum (1224.5 Å rest frame, black) from STIS data, and Hα (dashed red) from ACS data. Bottom: spatial profiles of Lyα (blue) and observed Lyα/Hα (solid black) and Hα/Hβ (from WHT/ISIS data, in red), and the expected Lyα/Hα ratio (dashed brown), assuming Case B recombination and internal reddening as derived from the Hα/Hβ ratio, as well as the Galactic extinction. The Lyα escape fraction  , as defined in the text, has been plotted in dotted black line. In the middle and bottom panels, the negative x-axis corresponds to north, as indicated by N. To ease the comparison, the dashed red line in the middle panel shows the Hα profile scaled by a factor 0.2. The vertical scale corresponds to the Lyα and non-scaled Hα fluxes. Whereas the vertical scale of the left axis in the bottom panel corresponds to the Lyα/Hα and Hα/Hβ ratios, the scale of the right axis corresponds to . Position of the region LyαS is marked.
Current usage metrics show cumulative count of Article Views (full-text article views including HTML views, PDF and ePub downloads, according to the available data) and Abstracts Views on Vision4Press platform.
Data correspond to usage on the plateform after 2015. The current usage metrics is available 48-96 hours after online publication and is updated daily on week days.
Initial download of the metrics may take a while.