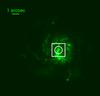
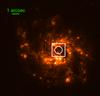
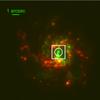
Fig. 4
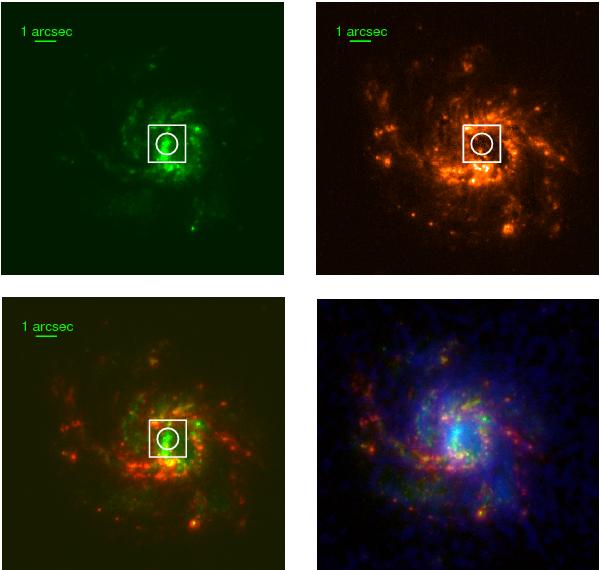
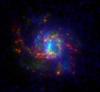
HST/ACS images of IRAS 0833 in the ultraviolet (filter F140LP, green, top left), continuum-subtracted Hα (red, top right), the composite of both (bottom left), and the composite including Lyα emission in blue (bottom right, adapted from Östlin et al. 2009). The aperture of HST/GHRS is marked with a square. The circular region R1 (radius ~0.5″ (~200 pc)), as discussed in the text, is also marked. Intensity scale is linear, except for the last image, in which intensity scale is logarithmic. North is up and east is to the left.
Current usage metrics show cumulative count of Article Views (full-text article views including HTML views, PDF and ePub downloads, according to the available data) and Abstracts Views on Vision4Press platform.
Data correspond to usage on the plateform after 2015. The current usage metrics is available 48-96 hours after online publication and is updated daily on week days.
Initial download of the metrics may take a while.