Free Access
Fig. 13
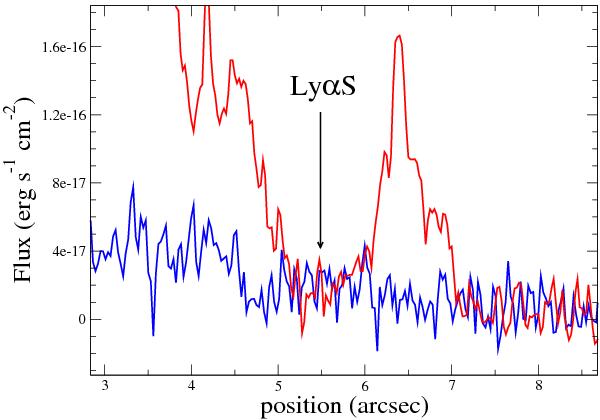
Detail of the Lyα (blue) and Hα (red) spatial profiles around the region at ~5.5″ (~2.1 kpc) south of the central SSC showing the highest value of the Lyα/Hα ratio (LyαS). The profiles have been plotted at their original resolution, 0.029 arcsec pixel-1 for Lyα and 0.025 arcsec pixel-1 for Hα.
Current usage metrics show cumulative count of Article Views (full-text article views including HTML views, PDF and ePub downloads, according to the available data) and Abstracts Views on Vision4Press platform.
Data correspond to usage on the plateform after 2015. The current usage metrics is available 48-96 hours after online publication and is updated daily on week days.
Initial download of the metrics may take a while.