Fig. 7
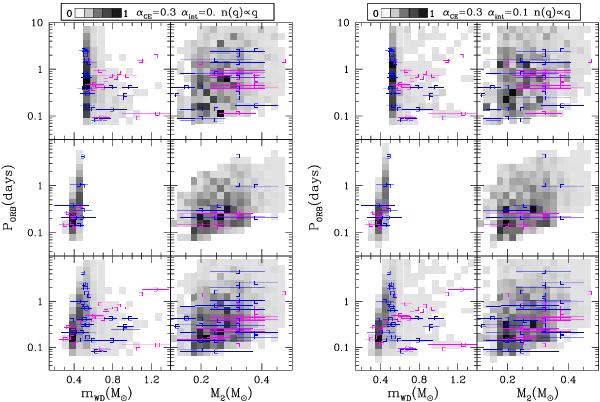
Period–mass density distribution of present-day WD+MS PCEBs for two of our four best models (gray scale) compared with the observational distribution (magenta and blue squares). The blue squares denote those systems for which the effective temperature of the WD is lower than 12 000 K, in which case the mass determination of the WD could be problematic. The top panels show the population of WD+MS PCEBs containing C/O or O/Ne WDs, middle panels are for systems containing a He WD, and the bottom ones show the entire population of WD+MS PCEBs simulated.
Current usage metrics show cumulative count of Article Views (full-text article views including HTML views, PDF and ePub downloads, according to the available data) and Abstracts Views on Vision4Press platform.
Data correspond to usage on the plateform after 2015. The current usage metrics is available 48-96 hours after online publication and is updated daily on week days.
Initial download of the metrics may take a while.