Fig. 3
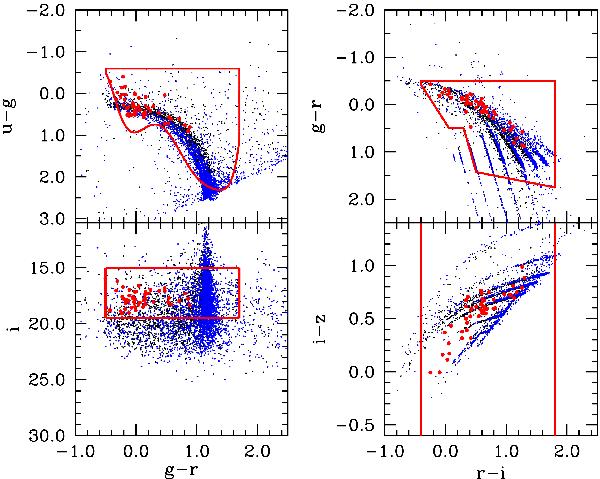
Color–color diagram of the synthetic WD+MS PCEBs obtained using our Monte Carlo simulator when our reference model (αCE = 1.0, λ = 0.5, and n(q) = 1) is employed. Systems containing He WDs are represented using black dots, while blue dots correspond to systems with C/O or O/Ne WDs. The observed WD+MS PCEB systems are displayed using red dots. The color selection criteria are shown using red lines (Sect. 3.1). (Color version online.)
Current usage metrics show cumulative count of Article Views (full-text article views including HTML views, PDF and ePub downloads, according to the available data) and Abstracts Views on Vision4Press platform.
Data correspond to usage on the plateform after 2015. The current usage metrics is available 48-96 hours after online publication and is updated daily on week days.
Initial download of the metrics may take a while.