Fig. 2
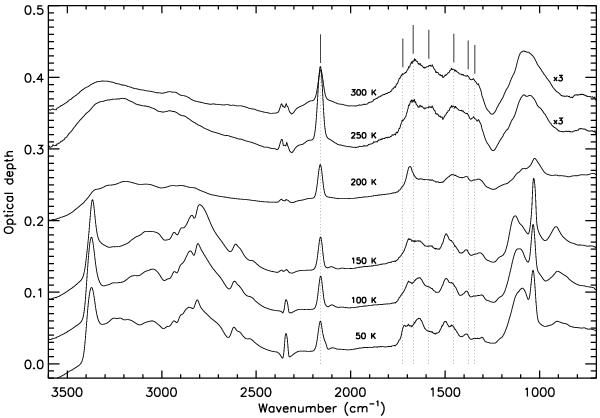
Warm-up spectra of UV-irradiated CH3OH:NH3 ice mixture. The vertical line positions from 2160 cm-1 to 1342 cm-1 are presented and assigned to different vibrations in Table 2. They correspond to the bands identified in the ion-irradiated mixture residues observed at 300 K for direct comparison with the UV-produced residue at the same temperature.
Current usage metrics show cumulative count of Article Views (full-text article views including HTML views, PDF and ePub downloads, according to the available data) and Abstracts Views on Vision4Press platform.
Data correspond to usage on the plateform after 2015. The current usage metrics is available 48-96 hours after online publication and is updated daily on week days.
Initial download of the metrics may take a while.