Free Access
Fig. 1
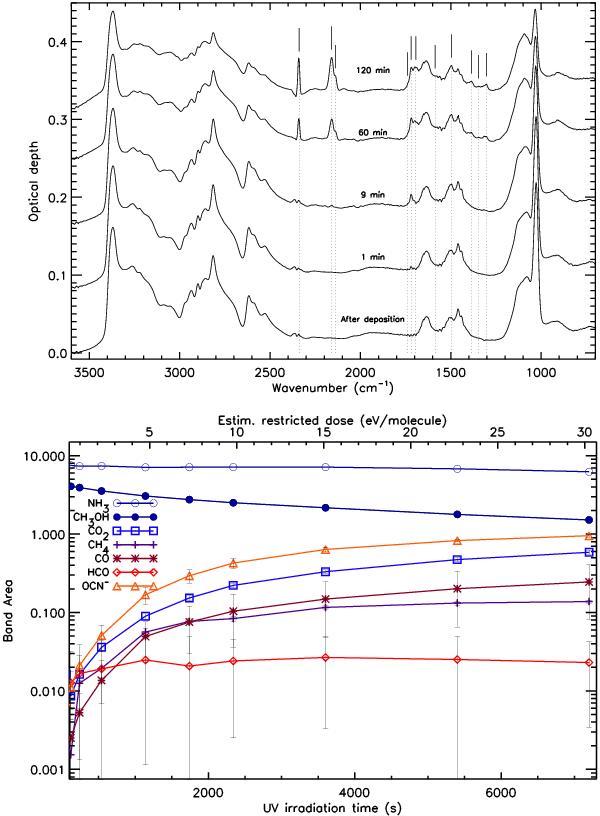
UV irradiation of CH3OH:NH3 ice mixture. The top panel shows the IR spectra at various irradiation times after deposition. The bottom panel shows the decrease of the starting ice bands, corresponding to NH3 and CH3OH, and the growth of various bands attributed to irradiation products: CO2, CH4, CO, HCO, and OCN−.
This figure is made of several images, please see below:
Current usage metrics show cumulative count of Article Views (full-text article views including HTML views, PDF and ePub downloads, according to the available data) and Abstracts Views on Vision4Press platform.
Data correspond to usage on the plateform after 2015. The current usage metrics is available 48-96 hours after online publication and is updated daily on week days.
Initial download of the metrics may take a while.