Fig. 5
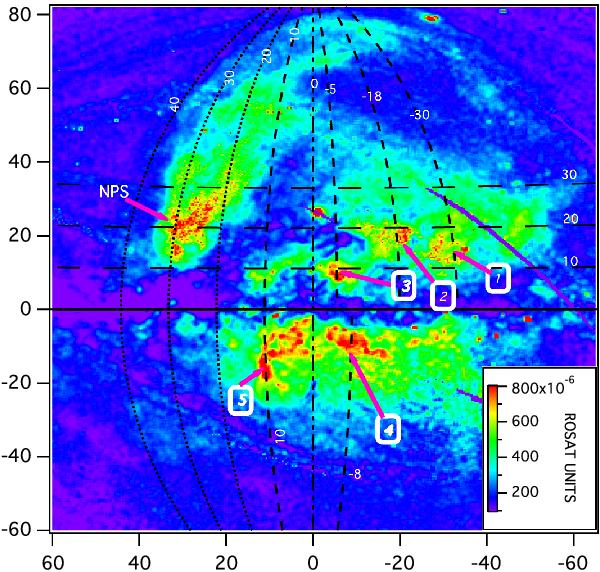
ROSAT 0.75 keV surface brightness map around the Galactic center. Five selected bright regions (red) are labeled and shown. The central parts of those regions correspond to the five LOS drawn in the four meridional cuts in Fig. 6 and the top-right of Fig. 7, allowing to correlate visually the bright X-ray sources (hot ISM) and low density regions or tunnels appearing in the 3D maps.
Current usage metrics show cumulative count of Article Views (full-text article views including HTML views, PDF and ePub downloads, according to the available data) and Abstracts Views on Vision4Press platform.
Data correspond to usage on the plateform after 2015. The current usage metrics is available 48-96 hours after online publication and is updated daily on week days.
Initial download of the metrics may take a while.