Fig. 4
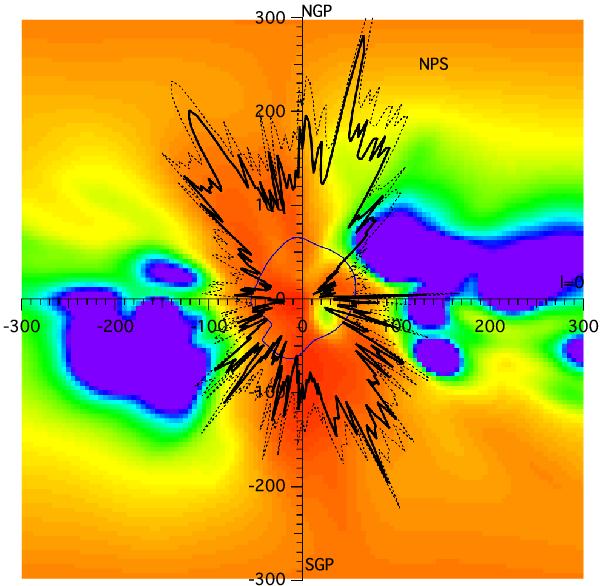
Inversion result (differential opacity) in the meridian plane. The Sun is at (0, 0). The color scale is identical to the one in Fig. 1. The Galactic center is to the right and the north Galactic pole (NGP) to the top. Superimposed are a polar plot of the 0.25 keV background (dashed black line), and a polar plot of the same emission after subtraction of the heliospheric counterpart (thick black line). The angular dependence of the heliospheric contribution is shown in blue. The jump in the region around l,b = (180°, −40°) is due to the ROSAT measurement geometry (see text). The scaling for the polar plot curves is done in the same manner as in Fig. 1. The spiked nature of the polar plot is due to the statistical variation of the X-ray data.
Current usage metrics show cumulative count of Article Views (full-text article views including HTML views, PDF and ePub downloads, according to the available data) and Abstracts Views on Vision4Press platform.
Data correspond to usage on the plateform after 2015. The current usage metrics is available 48-96 hours after online publication and is updated daily on week days.
Initial download of the metrics may take a while.