Fig. 3
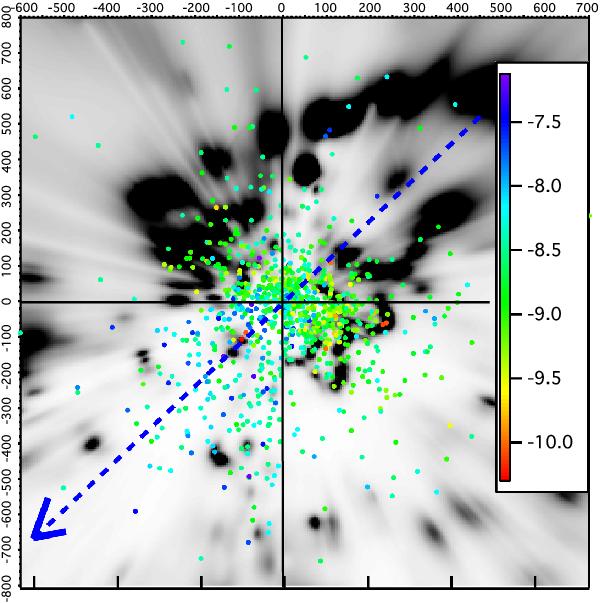
Dust–CaII comparison. Superimposed onto the GP dust distribution (black and white scale, distribution identical to the one in Fig. 1) are the projections of those stars located within 100 pc from the GP and for which CaII columns have been measured in absorption (colored dots). Units are in parsecs from the Sun (at center). The dot color represents the ratio between the CaII column measured towards the star and the hydrogen column that corresponds to its color excess. The color excess is computed by integrating the 3D differential color excess from the Sun to the star location. The hydrogen column is assumed to be 5 × 10²¹ × E(B − V) in cm-2 units. The color code refers to the logarithm of this ratio, in cm-2 mag-1. Stars in the large cavity in the 3rd quadrant have a particularly high CaII to dust (or equivalent H) ratio. The arrow marks the ionization gradient direction found by Wolff et al. (1999).
Current usage metrics show cumulative count of Article Views (full-text article views including HTML views, PDF and ePub downloads, according to the available data) and Abstracts Views on Vision4Press platform.
Data correspond to usage on the plateform after 2015. The current usage metrics is available 48-96 hours after online publication and is updated daily on week days.
Initial download of the metrics may take a while.