Fig. 2
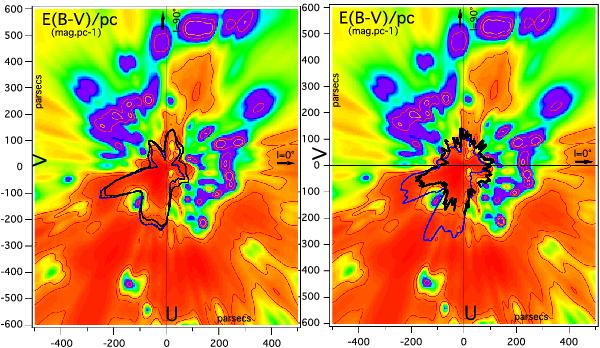
Same as Fig. 1 in a restricted area around the Sun. The color scale is identical to the one in Fig. 1. Left: a polar plot centered on the Sun shows the unabsorbed 0.25 keV diffuse background after removal of a heliospheric contribution. The black and blue curves correspond to different assumptions on the actual level of the heliospheric foreground (see text). Right: polar plots representing the total 0.25 keV background (absorbed + unabsorbed), after removal of the larger heliospheric contribution (see black line), and the result of a simplistic radiative transfer model assuming all cavities are filled with hot, homogeneous gas (blue line). The scaling for the polar plot curves is done in the same manner as in Fig. 1.
Current usage metrics show cumulative count of Article Views (full-text article views including HTML views, PDF and ePub downloads, according to the available data) and Abstracts Views on Vision4Press platform.
Data correspond to usage on the plateform after 2015. The current usage metrics is available 48-96 hours after online publication and is updated daily on week days.
Initial download of the metrics may take a while.