Fig. 10
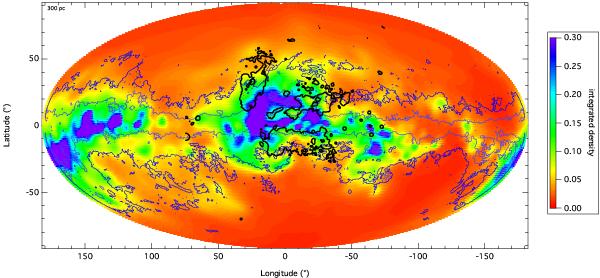
Integrated IS dust opacity from the Sun to 300 pc (based on the differential extinction 3D maps of Lallement et al. 2014). A 0.75 keV iso-brightness contour is superimposed (black line) as well as two iso-contours drawn from the Schlegel et al. (1998) dust maps (blue and violet lines).
Current usage metrics show cumulative count of Article Views (full-text article views including HTML views, PDF and ePub downloads, according to the available data) and Abstracts Views on Vision4Press platform.
Data correspond to usage on the plateform after 2015. The current usage metrics is available 48-96 hours after online publication and is updated daily on week days.
Initial download of the metrics may take a while.