Fig. 1
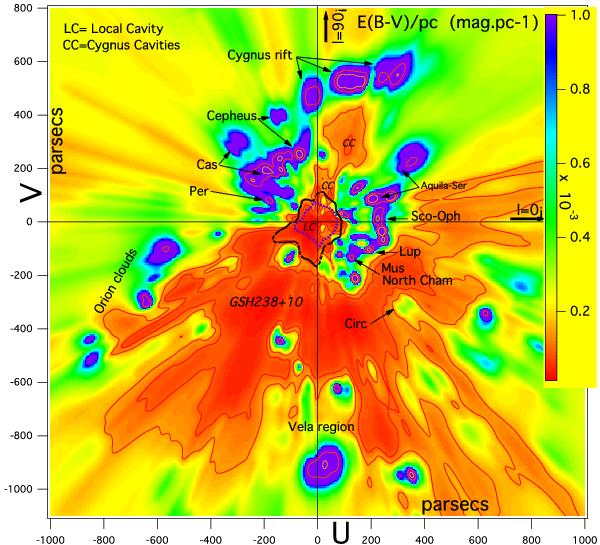
Differential color excess in the Galactic plane, derived by inversion of LOS data (map taken from Lallement et al. 2014). The Sun is at (0,0) and the Galactic center direction is to the right. Cavities (in red) are potential SXRB sources if they are filled with hot gas. A polar plot of the unabsorbed (foreground) 0.25 keV diffuse background derived from shadowing (Snowden 1998a) is shown superimposed in black (thick line), centered on the Sun. The linear scaling of the X-ray surface brightness, i.e., the ratio between surface brightnesses and parsecs, is chosen to be consistent with the physical extent of the LB. Also shown is the shape of the estimated average heliospheric contribution to the signal (dashed blue line). This contribution has been arbitrarily scaled to make it more visible and the heliospheric signal should not be directly compared here with the measured background.
Current usage metrics show cumulative count of Article Views (full-text article views including HTML views, PDF and ePub downloads, according to the available data) and Abstracts Views on Vision4Press platform.
Data correspond to usage on the plateform after 2015. The current usage metrics is available 48-96 hours after online publication and is updated daily on week days.
Initial download of the metrics may take a while.