Free Access
Fig. 4
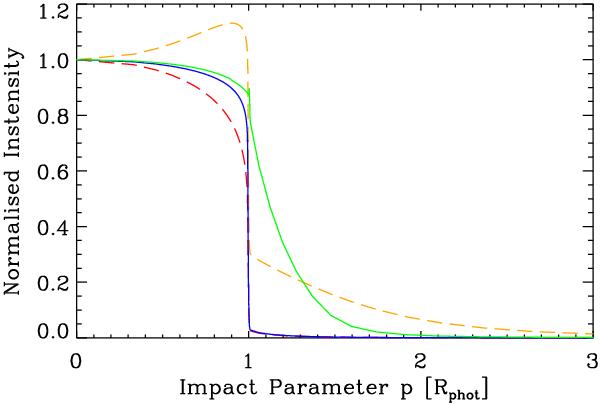
A CMFGEN comparison between the normalised intensity profiles I(p) of Rigel in the Hα line and its nearby continuum (dashed yellow and red lines, respectively), and the Brγ line and it nearby continuum (solid green and blue lines, respectively) for the model with Ṁ = 8 × 10⁻⁷ M⊙ yr-1.
Current usage metrics show cumulative count of Article Views (full-text article views including HTML views, PDF and ePub downloads, according to the available data) and Abstracts Views on Vision4Press platform.
Data correspond to usage on the plateform after 2015. The current usage metrics is available 48-96 hours after online publication and is updated daily on week days.
Initial download of the metrics may take a while.