Fig. 2
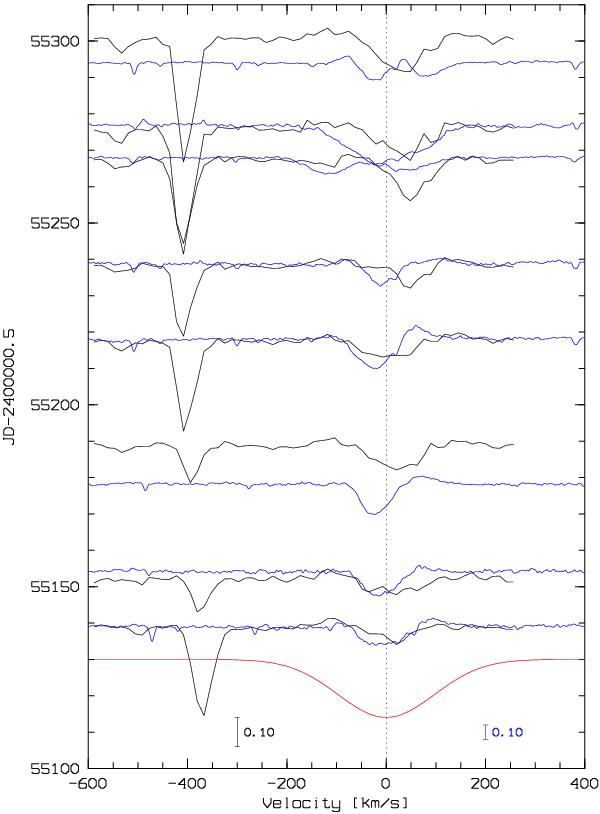
2009−2010 Brγ (black) and Hα (blue) time series of Rigel. The Brγ spectra are shown as the difference to an artificially created photospheric spectrum shown at MJD 55 130 (red). For Hα only the spectra taken closest in time to the Brγ spectra are shown. The normalised flux scale for Brγ is enlarged by a factor of two relative to the one of Hα to match the strength of profile variability of the two lines. The strong telluric water absorption line at − 400 km s-1 is not resolved and provides an estimate of the spectral resolution of the AMBER spectra around Brγ. The complete 2009 time series are shown in Figs. C.1 and C.2.
Current usage metrics show cumulative count of Article Views (full-text article views including HTML views, PDF and ePub downloads, according to the available data) and Abstracts Views on Vision4Press platform.
Data correspond to usage on the plateform after 2015. The current usage metrics is available 48-96 hours after online publication and is updated daily on week days.
Initial download of the metrics may take a while.