Fig. 8
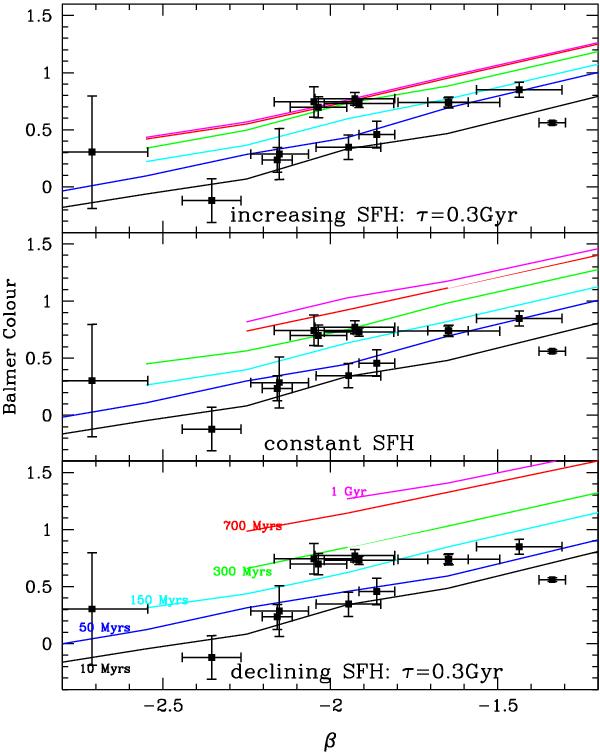
Amplitude of the Balmer break as a function of the UV slope for the objects in our sample (black squares and error-bars) compared to templates at different ages (continous lines: 0.01 Gyr to 1 Gyr from bottom to top) and star-formation histories: exponentially declining SFH (τ = 0.3 Gyr, bottom panel), constant SFH (central panel), exponentially increasing SFH (τ = 0.3 Gyr, top panel). The Balmer colour is defined as H160-0.5 × (K+3.6 μm) for objects and templates at z > 3.4, and J125-0.5 × (K+3.6 μm) for lower redshifts. The reddening vector in this plot is parallel to the displayed model tracks.
Current usage metrics show cumulative count of Article Views (full-text article views including HTML views, PDF and ePub downloads, according to the available data) and Abstracts Views on Vision4Press platform.
Data correspond to usage on the plateform after 2015. The current usage metrics is available 48-96 hours after online publication and is updated daily on week days.
Initial download of the metrics may take a while.