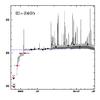
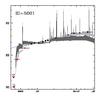
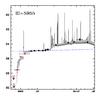
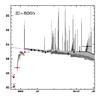
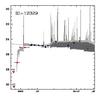
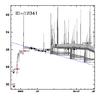
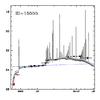
Fig. B.1
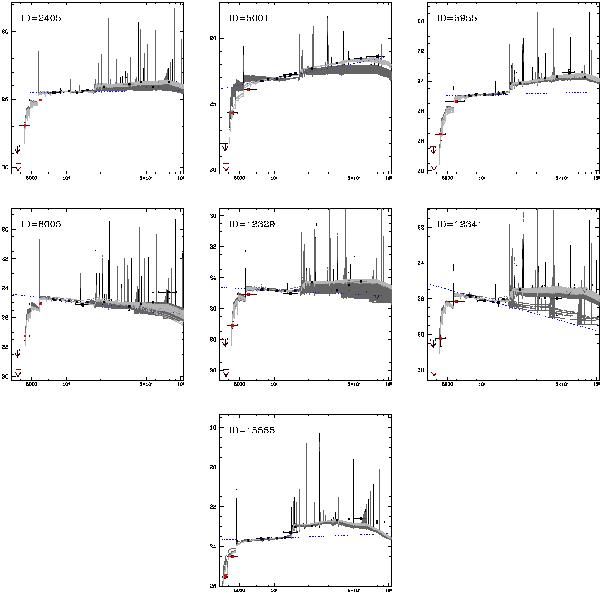
Spectral-energy distributions of the 14 objects analysed in this paper. Light (dark) grey curves in each plot show models with P(χ2) > 32% from the best fit, considering four different SFH and fits with stellar (stellar+nebular) emission (see Sect. 3). The best-fit UV slope is shown as a blue dashed line. The bands that are not used in the SED-fitting are shown in red.
Current usage metrics show cumulative count of Article Views (full-text article views including HTML views, PDF and ePub downloads, according to the available data) and Abstracts Views on Vision4Press platform.
Data correspond to usage on the plateform after 2015. The current usage metrics is available 48-96 hours after online publication and is updated daily on week days.
Initial download of the metrics may take a while.