Free Access
Fig. 8
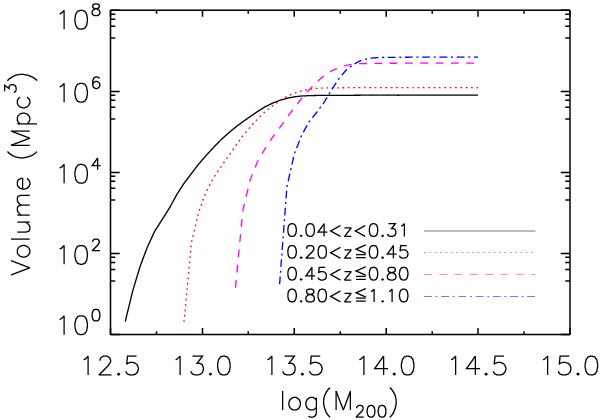
Survey volume as a function of halo mass. Solid black, dotted red, dashed magenta and dash-dotted blue curves present trends for the four redshift intervals, S-I to S-IV, which are described in Sect. 4.3.
Current usage metrics show cumulative count of Article Views (full-text article views including HTML views, PDF and ePub downloads, according to the available data) and Abstracts Views on Vision4Press platform.
Data correspond to usage on the plateform after 2015. The current usage metrics is available 48-96 hours after online publication and is updated daily on week days.
Initial download of the metrics may take a while.