Free Access
Fig. 7
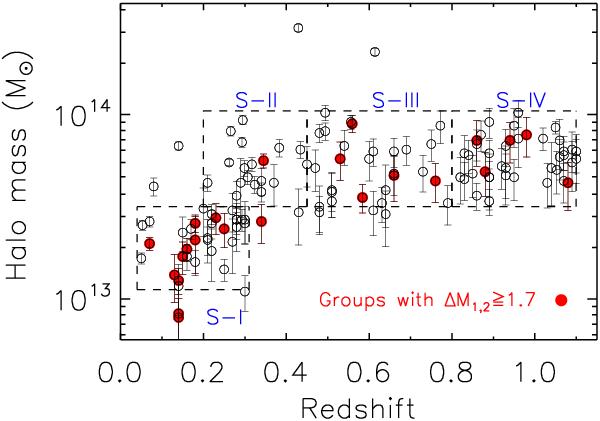
Halo mass versus redshift for the detected X-ray groups. Groups with ΔM1,2 ≥ 1.7 have been marked with red filled circles. The dashed boxes show the four subsamples, defined in Sect. 4.3.
Current usage metrics show cumulative count of Article Views (full-text article views including HTML views, PDF and ePub downloads, according to the available data) and Abstracts Views on Vision4Press platform.
Data correspond to usage on the plateform after 2015. The current usage metrics is available 48-96 hours after online publication and is updated daily on week days.
Initial download of the metrics may take a while.