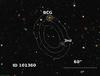
Fig. 6
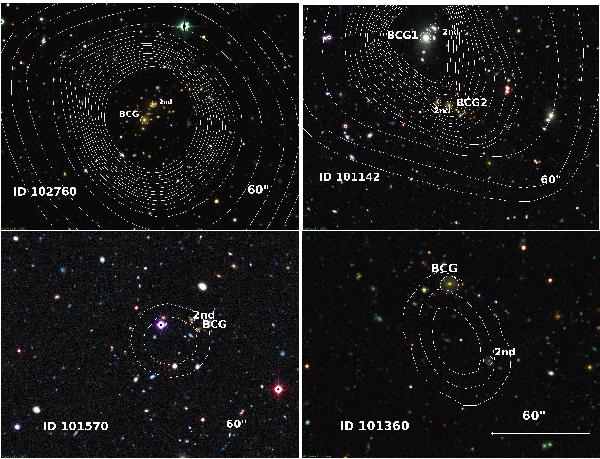
Contours of the extended X-ray emission overlaid on the CFHTLS RGB image in i′, r′, g′ filters. Top left panel shows a spectroscopically confirmed cluster at z = 0.47 within the center of X-ray emission and having a single optical counterpart, with a high significance of X-ray flux estimate (flag = 1 and flag = 3 if without the spectroscopic confirmation). Top right panel, assigned with a flag = 2, indicates a presence of two overlapping X-ray sources at z = 0.52 and z = 0.15. The bottom left image shows the multiple optical counterparts within the X-ray emission with no possibility of separating out their contributions (flag = 4). The bottom right panel shows a galaxy group at z = 0.60 located at the edge of X-ray emission (flag = 5). The scale bar is presented in each image.
Current usage metrics show cumulative count of Article Views (full-text article views including HTML views, PDF and ePub downloads, according to the available data) and Abstracts Views on Vision4Press platform.
Data correspond to usage on the plateform after 2015. The current usage metrics is available 48-96 hours after online publication and is updated daily on week days.
Initial download of the metrics may take a while.