Fig. 4
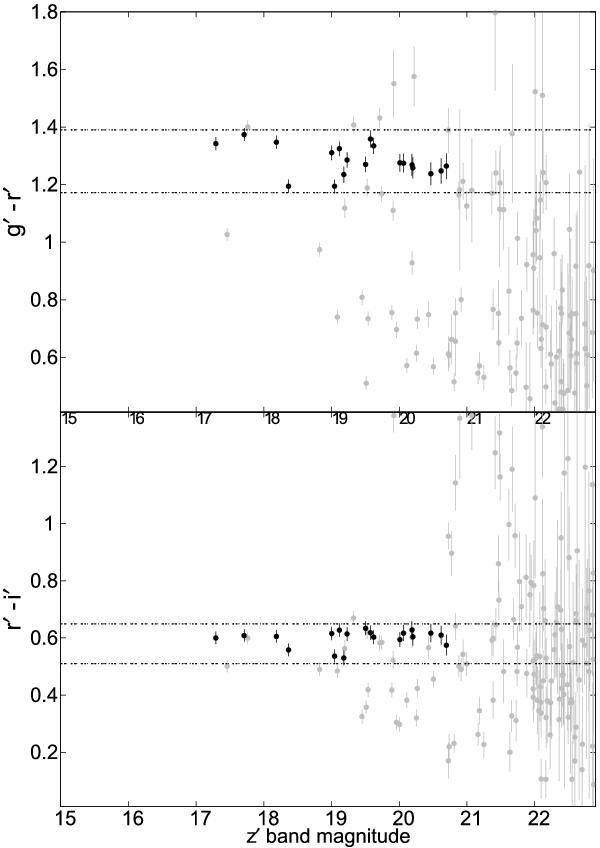
Example of using two-color magnitude diagrams to identify the red sequence of a galaxy cluster at z = 0.28 (cluster 100320). Top and bottom panels show g′-r′ and r′-i′ versus z′-band magnitude, respectively. Gray points are all galaxies within the radius of 0.5 Mpc from the X-ray source center. Black dots are red galaxy group members selected according to the method described in Sect. 4.1. The upper and the lower ranges of colors are shown with the horizontal dashed lines.
Current usage metrics show cumulative count of Article Views (full-text article views including HTML views, PDF and ePub downloads, according to the available data) and Abstracts Views on Vision4Press platform.
Data correspond to usage on the plateform after 2015. The current usage metrics is available 48-96 hours after online publication and is updated daily on week days.
Initial download of the metrics may take a while.