Fig. 22
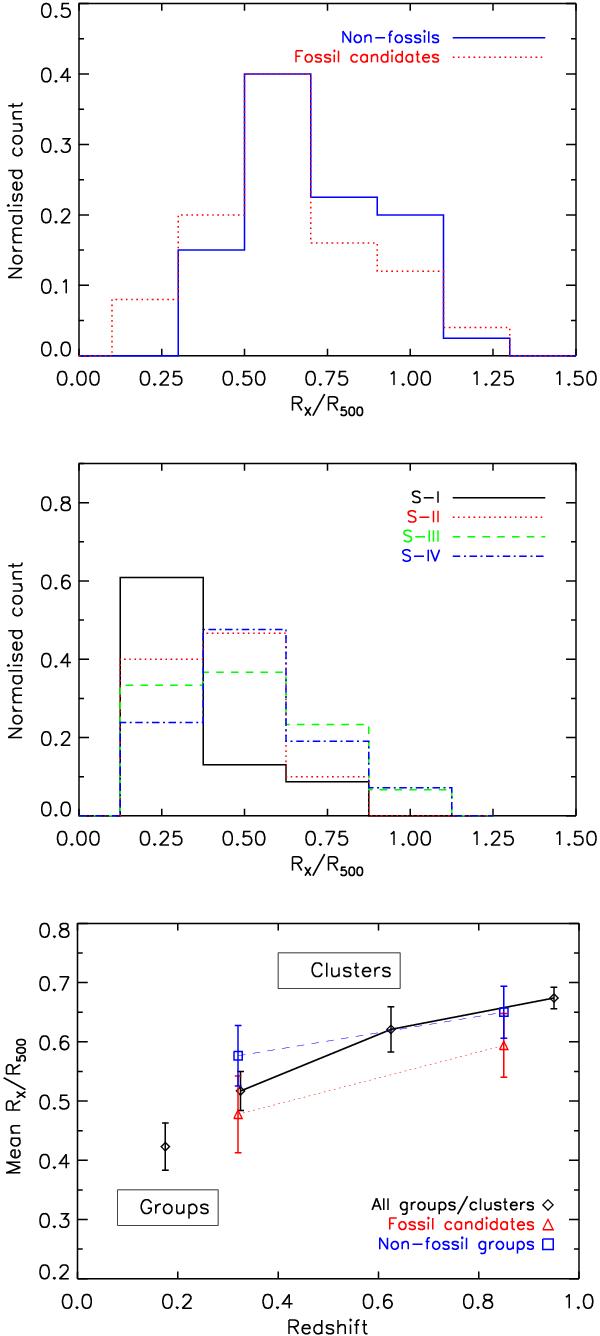
Upper panel. Distribution of the ratio of the X-ray extent of the detection to the total extent of X-ray emission,  for the fossil group candidates (ΔM1,2 ≥ 1.7) (dotted blue histogram) and non-fossils (ΔM1,2 ≤ 0.5) (solid red histogram) in our X-ray group catalog. The fraction of fossil groups is skewed toward the lower values of compared to the non-fossil groups. Middle panel. The
  distribution for X-ray groups in different subsamples. Lower panel. The redshift evolution of the extent of X-ray detection for galaxy groups/clusters. A redshift evolution in the ratio by 0.25 in amplitude is seen for all groups.
Current usage metrics show cumulative count of Article Views (full-text article views including HTML views, PDF and ePub downloads, according to the available data) and Abstracts Views on Vision4Press platform.
Data correspond to usage on the plateform after 2015. The current usage metrics is available 48-96 hours after online publication and is updated daily on week days.
Initial download of the metrics may take a while.