Fig. 20
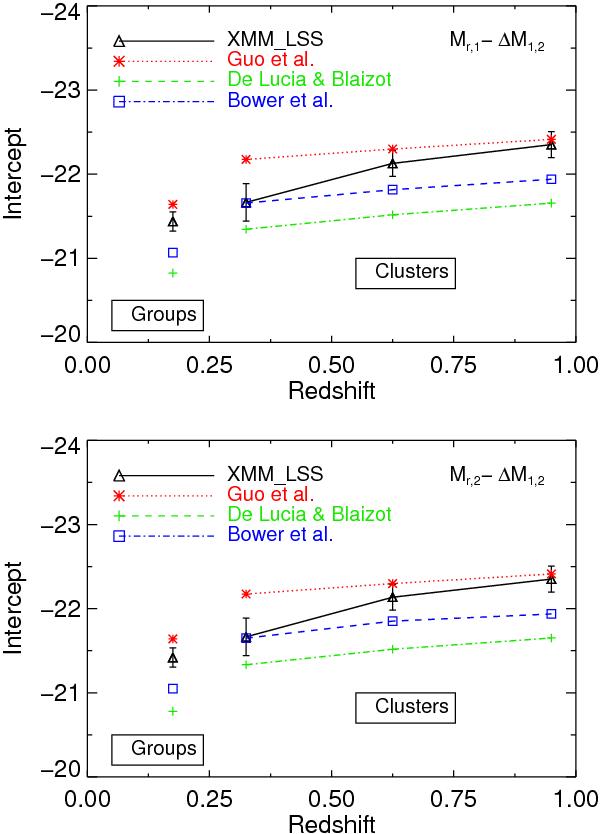
Evolution of the zero point of the Mr,1–ΔM1,2 (upper panel.) and Mr,2– ΔM1,2 (bottom panel.) relations with redshift. The solid black curve with error bars represents the data. Dotted red, dashed blue and dash-dotted green curves show the model predictions of G11, B06 and DLB07, respectively. In contrast to the models, we observe a significant evolution with redshift.
Current usage metrics show cumulative count of Article Views (full-text article views including HTML views, PDF and ePub downloads, according to the available data) and Abstracts Views on Vision4Press platform.
Data correspond to usage on the plateform after 2015. The current usage metrics is available 48-96 hours after online publication and is updated daily on week days.
Initial download of the metrics may take a while.