Fig. 2
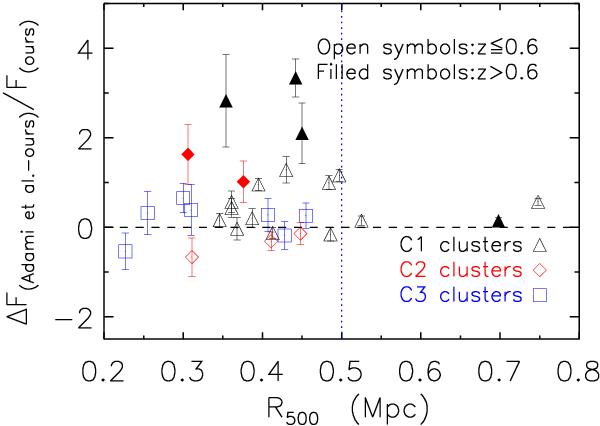
Comparison of the reported flux in the 0.5–2 keV band for galaxy groups and clusters in common between Adami et al. (2011) and our catalog, (FluxAdami/ FluxOurs − 1) versus R500 (Mpc). We illustrate C1 clusters with black triangles, C2 clusters with red diamonds and C3 clusters with blue squares. The filled and open symbols show galaxy groups and clusters at redshift ranges z> 0.6 and z ≤ 0.6, respectively. The vertical dashed blue line at 0.5 Mpc, marks the fixed radius used for the flux estimates in Adami et al. (2011).
Current usage metrics show cumulative count of Article Views (full-text article views including HTML views, PDF and ePub downloads, according to the available data) and Abstracts Views on Vision4Press platform.
Data correspond to usage on the plateform after 2015. The current usage metrics is available 48-96 hours after online publication and is updated daily on week days.
Initial download of the metrics may take a while.