Fig. 16
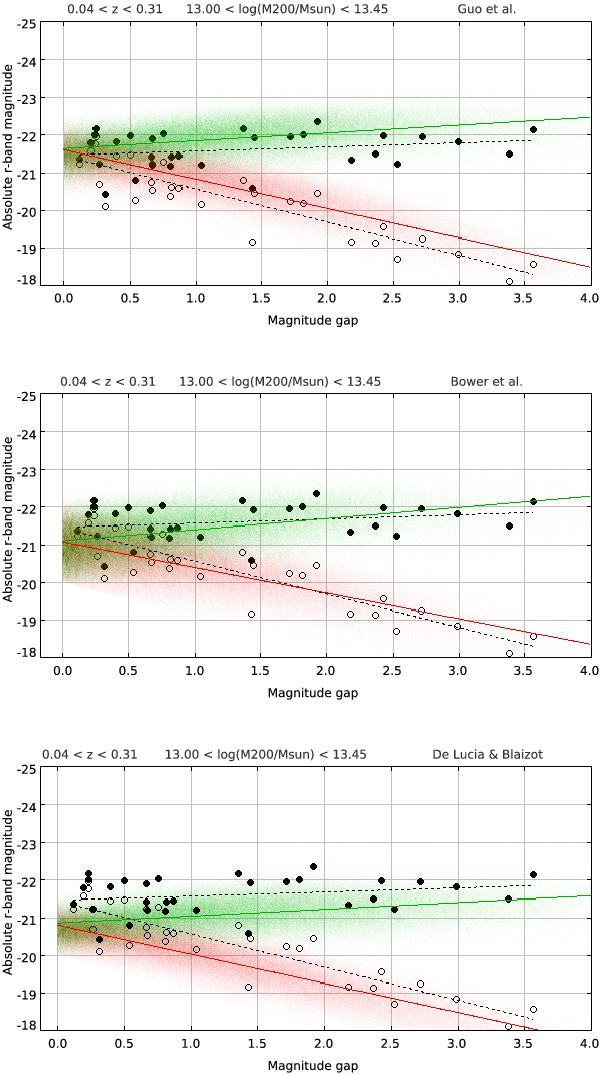
Absolute r-band magnitudes of the first and the second brightest galaxies as a function of the magnitude gap. The S–I data are shown by filled (BCG) and open (2nd-ranked galaxy) black circles with the dashed black lines showing the linear fit. Each panel shows the results of one of the SAMs (G11–top, B06–middle, DLB07–bottom), with green (red) points and a line showing the individual points and the fit to the BCG (2nd-ranked galaxy).
Current usage metrics show cumulative count of Article Views (full-text article views including HTML views, PDF and ePub downloads, according to the available data) and Abstracts Views on Vision4Press platform.
Data correspond to usage on the plateform after 2015. The current usage metrics is available 48-96 hours after online publication and is updated daily on week days.
Initial download of the metrics may take a while.