Fig. 15
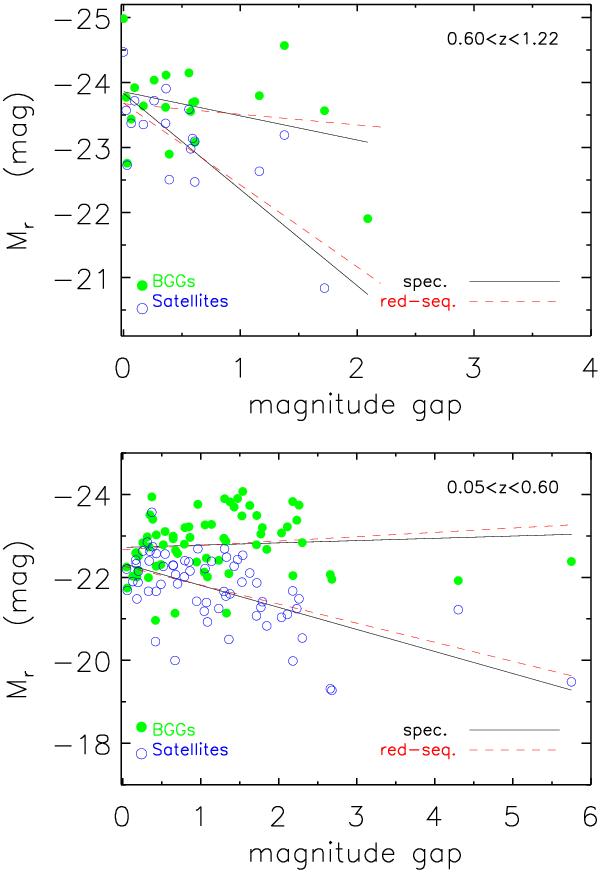
Absolute r-band magnitudes of the first (filled green circles) and the second (open blue circles) brightest galaxies as a function of the magnitude gap for the COSMOS+AEGIS+XMM-LSS sample of groups, having spectroscopic members. The solid black and dashed red lines show linear fits for the spectroscopic and red sequence selections of group membership, respectively. The upper panel and lower panel show the butterfly diagrams for high-z and low-z groups, respectively.
Current usage metrics show cumulative count of Article Views (full-text article views including HTML views, PDF and ePub downloads, according to the available data) and Abstracts Views on Vision4Press platform.
Data correspond to usage on the plateform after 2015. The current usage metrics is available 48-96 hours after online publication and is updated daily on week days.
Initial download of the metrics may take a while.