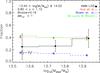
Fig. 13
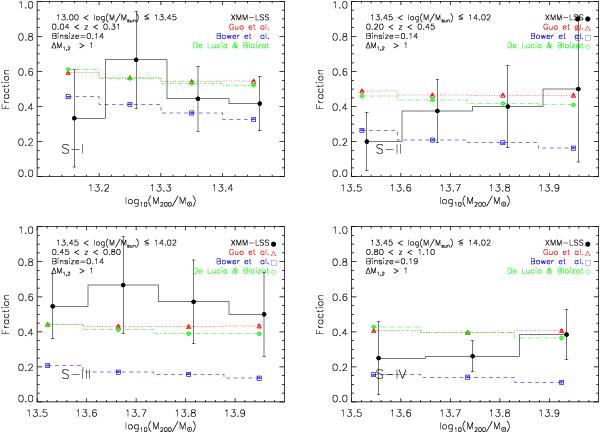
Halo mass dependence of the fraction of groups with ΔM1,2> 1. Black points with error bars show the data and dotted red, dashed blue and dash-dotted green histograms present model predictions of G11, B06 and DLB07, respectively for S–I (top left panel), S–II (top right panel), S–III (bottom left panel) and S–IV (bottom right panel). While the data are in agreement with the models, the low statistics of the data prevents us from choosing the best model.
Current usage metrics show cumulative count of Article Views (full-text article views including HTML views, PDF and ePub downloads, according to the available data) and Abstracts Views on Vision4Press platform.
Data correspond to usage on the plateform after 2015. The current usage metrics is available 48-96 hours after online publication and is updated daily on week days.
Initial download of the metrics may take a while.