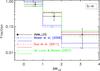
Fig. 12
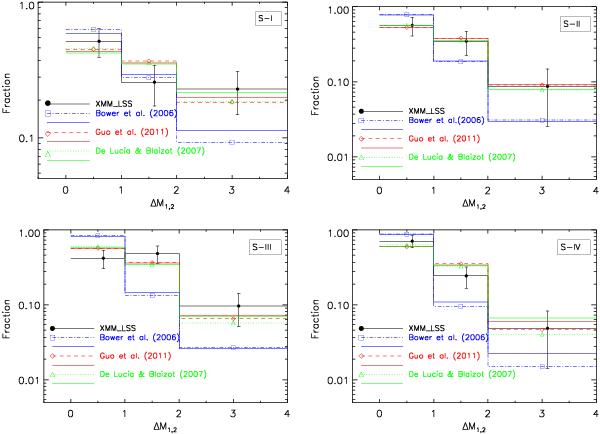
Observed fraction of galaxy groups as a function of their magnitude gap (black points with error bars) compared to the predictions of semi-analytic galaxy formation models, B06 (solid and dash-dotted blue histograms), DLB07 (solid and dotted green histograms) and G11 (solid and dashed red histograms) for S–I (top left panel), S–II (top right panel), S–III (bottom left panel) and S–IV (bottom right panel). We find that the fraction of groups declines with magnitude gap at all redshifts. Magnitude gap bin sizes are equal to one magnitude for ΔM1,2< 2. ΔM1,2 ≥ 2 systems are plotted as a 2 mag wide bin.
Current usage metrics show cumulative count of Article Views (full-text article views including HTML views, PDF and ePub downloads, according to the available data) and Abstracts Views on Vision4Press platform.
Data correspond to usage on the plateform after 2015. The current usage metrics is available 48-96 hours after online publication and is updated daily on week days.
Initial download of the metrics may take a while.