Free Access
Fig. 10
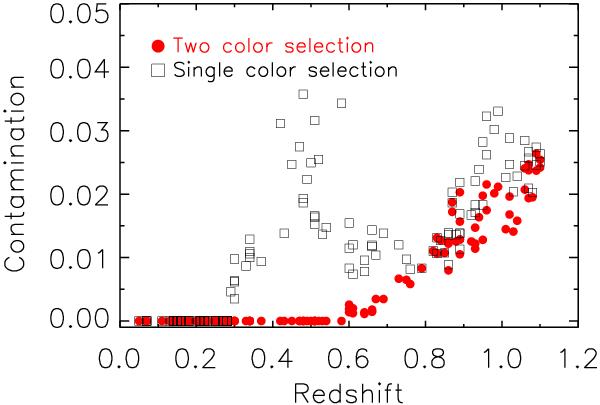
Model prediction for red sequence contamination by dusty star-burst galaxies versus redshift of group. The filled red circles and open black squares show the contamination for the two- and single-color selection of group members.
Current usage metrics show cumulative count of Article Views (full-text article views including HTML views, PDF and ePub downloads, according to the available data) and Abstracts Views on Vision4Press platform.
Data correspond to usage on the plateform after 2015. The current usage metrics is available 48-96 hours after online publication and is updated daily on week days.
Initial download of the metrics may take a while.