Fig. 9
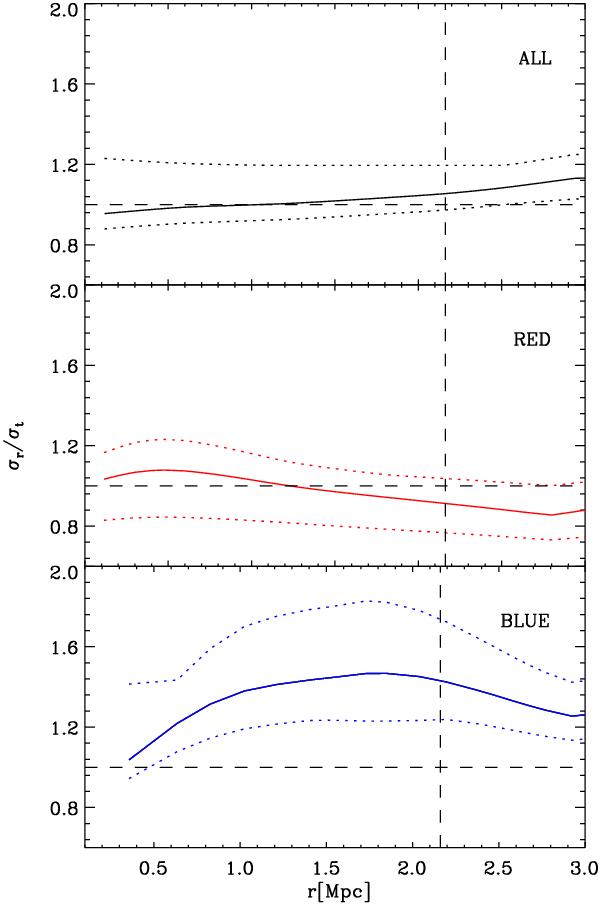
Velocity anisotropy profiles for the ALL, RED, and BLUE samples. The solid line is the result of the inversion of the Jeans equation, while the dotted lines are the 1 σ confidence intervals. The vertical dashed line locates the virial radius.
Current usage metrics show cumulative count of Article Views (full-text article views including HTML views, PDF and ePub downloads, according to the available data) and Abstracts Views on Vision4Press platform.
Data correspond to usage on the plateform after 2015. The current usage metrics is available 48-96 hours after online publication and is updated daily on week days.
Initial download of the metrics may take a while.