Fig. 8
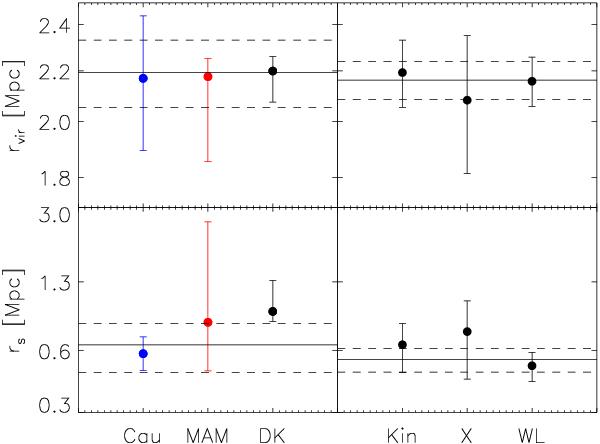
Virial (top panels) and mass scale (bottom panels) radius for all the methods. Left panels: blue diamonds are values obtained from the caustic technique, red ones for MAMPOSSt, and black ones for DK (from left to right, respectively). The average value and its error are the solid and dashed lines, respectively. See the text for the computation of the error. Right panels: values obtained from the kinematical analysis, X-ray and WL (from left to right, respectively). The average value and its error are the solid and dashed lines, respectively.
Current usage metrics show cumulative count of Article Views (full-text article views including HTML views, PDF and ePub downloads, according to the available data) and Abstracts Views on Vision4Press platform.
Data correspond to usage on the plateform after 2015. The current usage metrics is available 48-96 hours after online publication and is updated daily on week days.
Initial download of the metrics may take a while.