Fig. 7
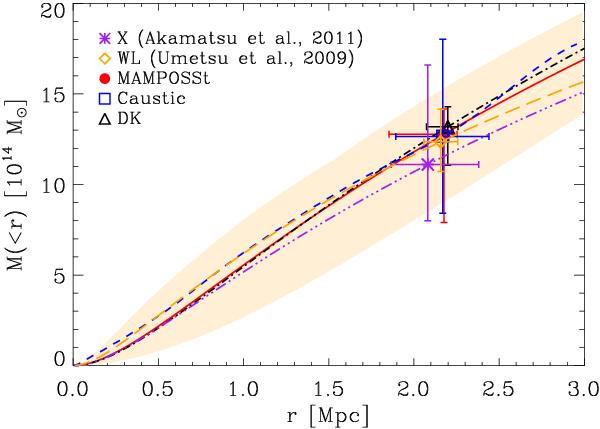
Mass profiles computed from the different methods. The black dash-dotted line and the triangle with error bars refer to DK technique, the dashed blue line and blue square to the caustic method, the solid red line and red point to MAMPOSSt. The symbols with error bars refer to the virial mass and radius. The purple asterisk with error bars and the purple dash triple dotted line are the result of the X-ray analysis, while the orange diamond with a long dashed line is the one coming from weak lensing analysis. The shaded area is the 1σ confidence region of the mass profile according to the MAMPOSSt results.
Current usage metrics show cumulative count of Article Views (full-text article views including HTML views, PDF and ePub downloads, according to the available data) and Abstracts Views on Vision4Press platform.
Data correspond to usage on the plateform after 2015. The current usage metrics is available 48-96 hours after online publication and is updated daily on week days.
Initial download of the metrics may take a while.