Fig. 6
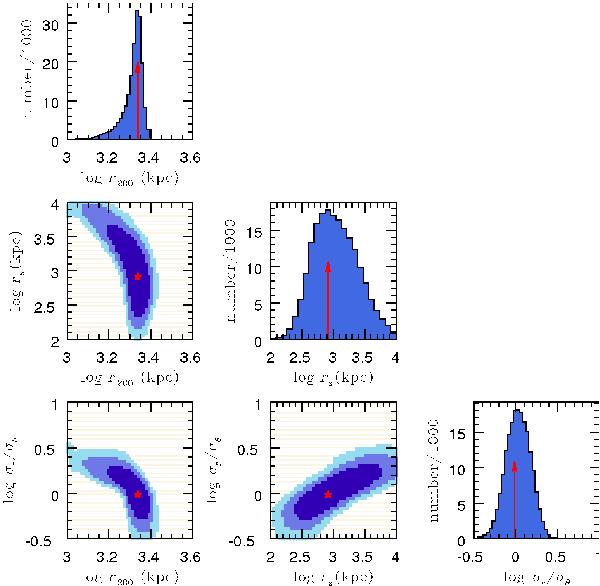
Parameter space and probability distribution functions for the virial radius, mass profile scale radius, and velocity anisotropy, as found by MAMPOSSt. The coloured regions are the 1, 2, 3σ confidence regions, while the red stars and the red arrows locate the best-fit values. These are based upon an MCMC analysis with 6 chains of 40000 elements each, with the first 5000 elements of each chain removed (this is the burn-in phase that is sensitive to the starting point of the chain). The priors were flat within the range of each panel, and zero elsewhere.
Current usage metrics show cumulative count of Article Views (full-text article views including HTML views, PDF and ePub downloads, according to the available data) and Abstracts Views on Vision4Press platform.
Data correspond to usage on the plateform after 2015. The current usage metrics is available 48-96 hours after online publication and is updated daily on week days.
Initial download of the metrics may take a while.