Fig. 14
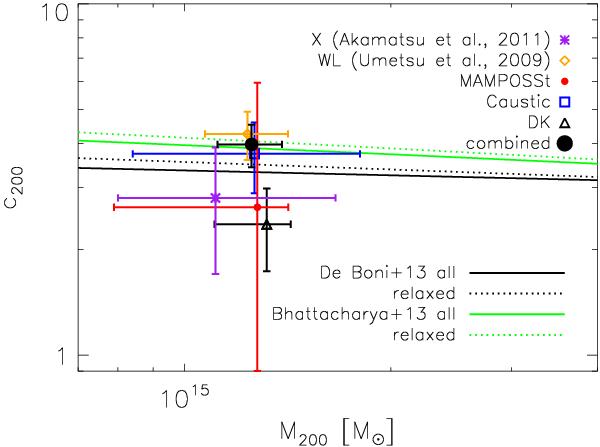
Concentration–mass relation, with respect to an overdensity 200 times the critical one. Purple asterisk refers to the X-ray values by Akamatsu et al. (2011), orange diamond to the WL values by Umetsu et al. (2009), small red circle refers to the values obtained by MAMPOSSt, blue square by the caustic method, black triangle by DK, the big black circle to the values of the combined model. Lines are the theoretical predictions, and in black the relations by De Boni et al. (2013) when considering all (solid) and relaxed (dotted) clusters. In green the relations by Bhattacharya et al. (2013) when considering all (solid) and relaxed (dotted) clusters.
Current usage metrics show cumulative count of Article Views (full-text article views including HTML views, PDF and ePub downloads, according to the available data) and Abstracts Views on Vision4Press platform.
Data correspond to usage on the plateform after 2015. The current usage metrics is available 48-96 hours after online publication and is updated daily on week days.
Initial download of the metrics may take a while.