Fig. 11
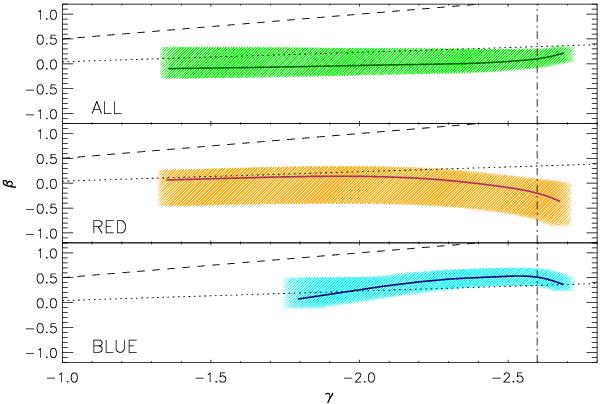
Velocity anisotropy versus logarithmic slope of the total density profile. The samples are ALL galaxies (top), RED (middle), and BLUE galaxies (bottom panel). The shaded areas are the 1σ confidence regions. The β − γ relation found by Hansen & Moore (2006) for single-component dissipationless simulations is shown as the dotted lines. The dashed line is the limit below which the relation by Ciotti & Morganti (2010) holds. The vertical dot-dashed line locates the value of γ at the virial radius.
Current usage metrics show cumulative count of Article Views (full-text article views including HTML views, PDF and ePub downloads, according to the available data) and Abstracts Views on Vision4Press platform.
Data correspond to usage on the plateform after 2015. The current usage metrics is available 48-96 hours after online publication and is updated daily on week days.
Initial download of the metrics may take a while.