Fig. 10
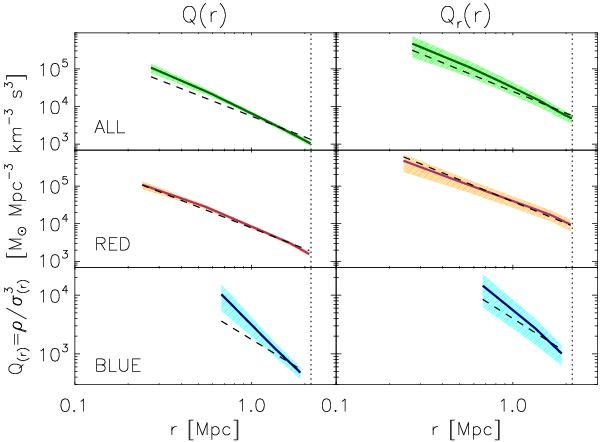
Radial profiles of Q (left columns) and Qr (right columns) within the virial radius, and the 1σ confidence regions (shaded areas), for different types of member tracers: green for the ALL sample (top panels), red for the RED sample (middle panels), and blue for the BLUE sample. The shaded areas represent the propagation of the errors associated with ρ, σ and σr. The dashed lines are the power-law relations Q(r) ∝ r-1.84 and Qr(r) ∝ r-1.92 found by Dehnen & McLaughlin (2005) on numerically simulated haloes. The vertical dotted lines locate the virial radius of the combined model (see Sect. 4).
Current usage metrics show cumulative count of Article Views (full-text article views including HTML views, PDF and ePub downloads, according to the available data) and Abstracts Views on Vision4Press platform.
Data correspond to usage on the plateform after 2015. The current usage metrics is available 48-96 hours after online publication and is updated daily on week days.
Initial download of the metrics may take a while.