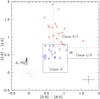
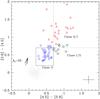
Fig. 9
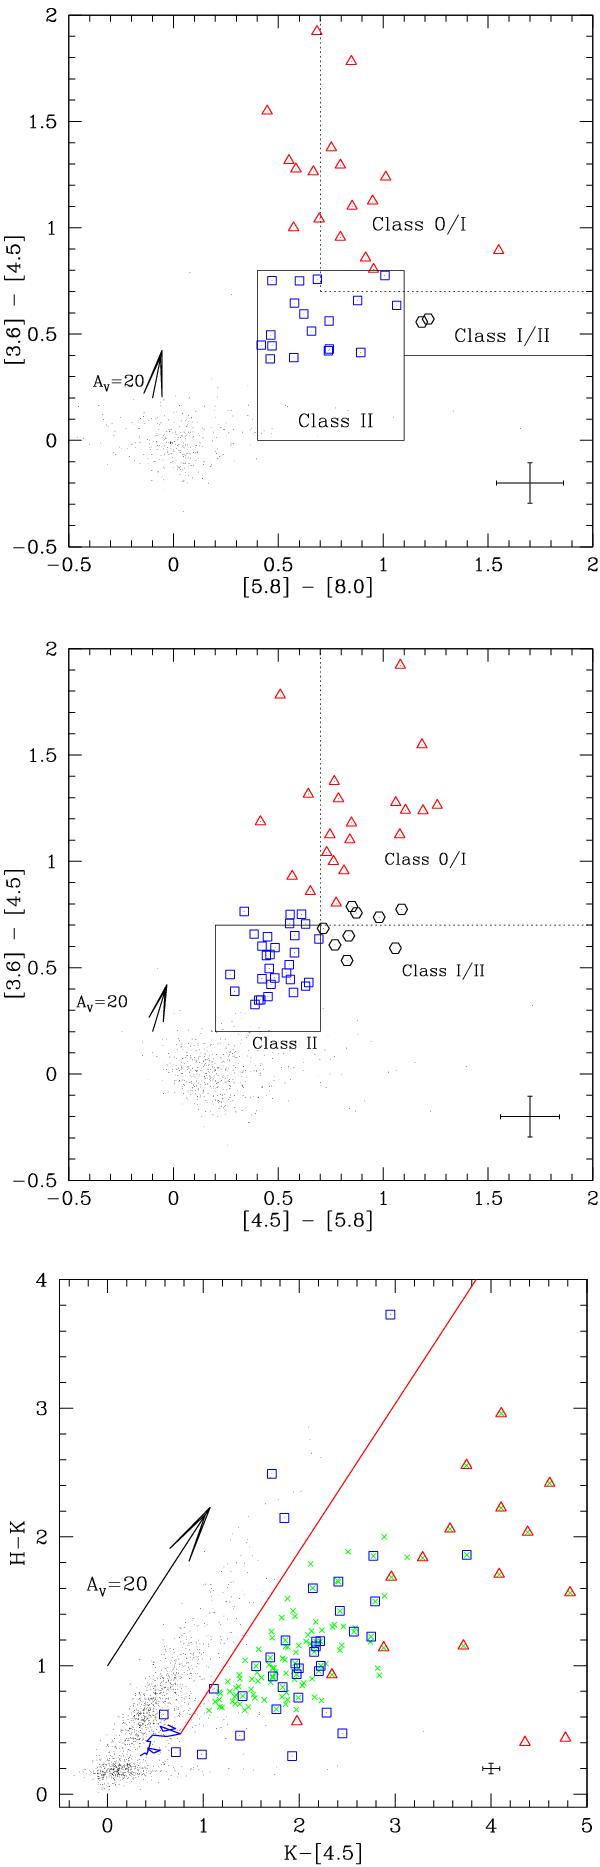
Top: IRAC [3.6]−[4.5] vs. [5.8]−[8.0] CC diagram with boxes representing the boundaries of different classes of sources. Middle: IRAC [4.5]−[5.8] vs. [3.6]−[4.5] CC diagram with boxes representing the boundaries of different classes of sources. The Class 0/I, Class I/II, and Class II sources are marked with triangles, hexagons, and squares, respectively. Bottom: the H − K vs. K–[4.5] CC diagram. The curved solid line (blue) is the MS locus of late M-type dwarfs (Patten et al. 2006). The long solid line (red) represents the reddening vector from the tip of a M6 dwarf. The crosses represent the extra NIR-excess sources identified from this diagram, whereas the YSOs identified only with the Spitzer bands are marked in squares (Class I/II plus Class II) and triangles (Class 0/I), respectively. A reddening vector of AV = 20 mag and mean error bars of the colors are shown in these diagrams. The mean color errors of [3.6]−[4.5], [4.5]−[5.8], [5.8]−[8.0], K–[4.5], and H − K are 0.09, 0.14, 0.16, 0.08, and 0.04, respectively.
Current usage metrics show cumulative count of Article Views (full-text article views including HTML views, PDF and ePub downloads, according to the available data) and Abstracts Views on Vision4Press platform.
Data correspond to usage on the plateform after 2015. The current usage metrics is available 48-96 hours after online publication and is updated daily on week days.
Initial download of the metrics may take a while.