Fig. 8
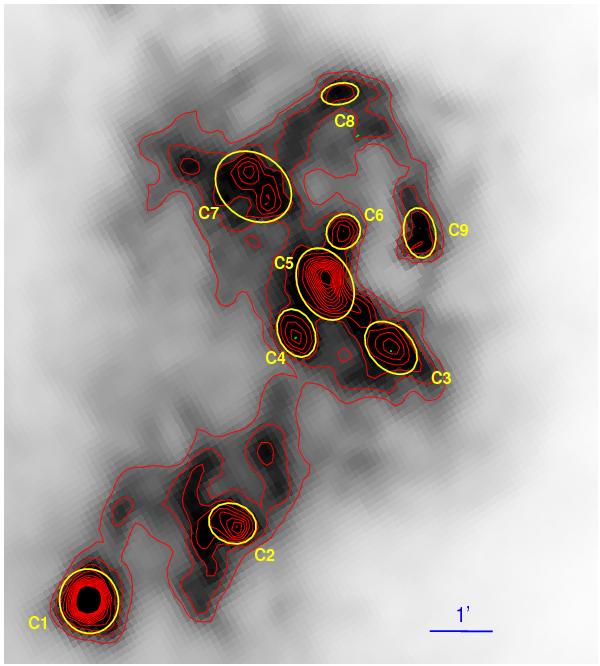
250 μm cold dust emission contours superimposed on the 250 μm image. The image is centered at α2000 = 19h49m16s, δ2000 = + 26°49′39′′. The contour levels are in the range from 980 MJy sr-1 to 3000 MJy sr-1 at intervals of 199 MJy sr-1. North is up and east is to the left. The clumps discussed in the text are labeled C1 to C9. The yellow ellipses are the apertures used to integrate the 250 μm fluxes.
Current usage metrics show cumulative count of Article Views (full-text article views including HTML views, PDF and ePub downloads, according to the available data) and Abstracts Views on Vision4Press platform.
Data correspond to usage on the plateform after 2015. The current usage metrics is available 48-96 hours after online publication and is updated daily on week days.
Initial download of the metrics may take a while.