Fig. 7
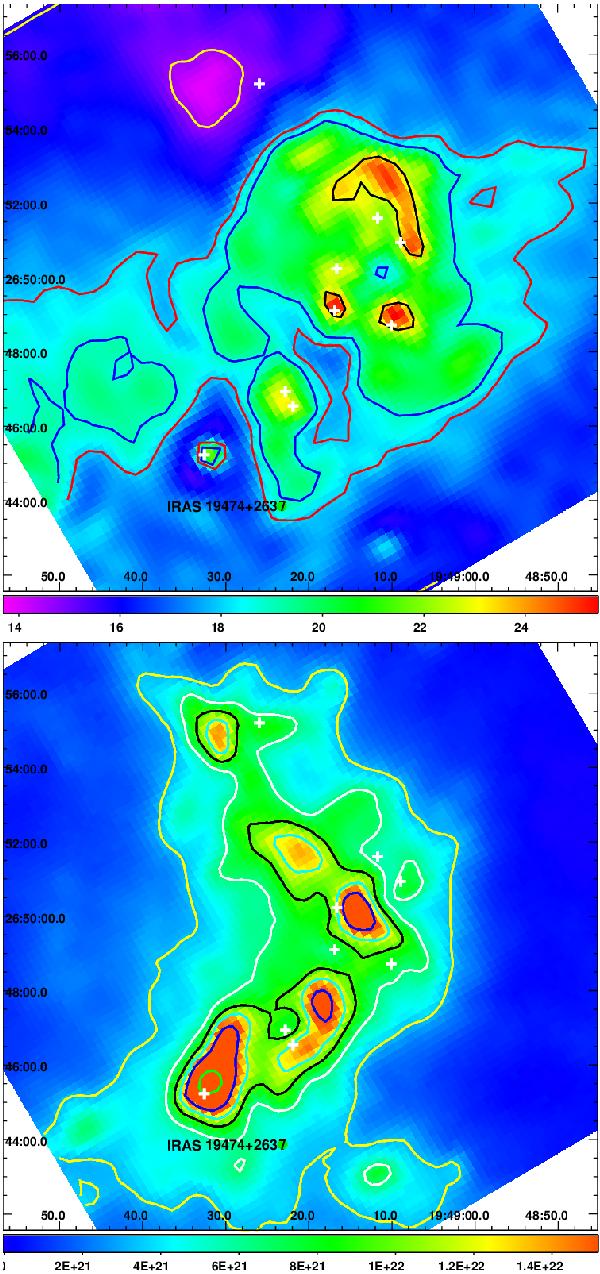
Top: dust temperature map of the Sh2-90 complex centered at α2000 = 19h49m21s, δ2000 = + 26°50′18′′. The horizontal color bar is labeled in units of kelvin (K) and the contours are at 14.6 K (yellow), 18 K (red), 19 K (blue) and 23 K (black). The map was obtained by fitting the dust emission between 160 μm and 500 μm. Bottom: H2 column density map of the same region. The horizontal color bar is labeled in units of cm-2 and the contours are at 3.3 (yellow), 6.4 (white), 9.3 (black), 12 (cyan), 16 (blue) and 32 (green) × 1021 cm-2. North is up and east is to the left. The labeled axes are in J2000 coordinates. The plus symbols represent the locations of the IR sources shown in Fig. 1.
Current usage metrics show cumulative count of Article Views (full-text article views including HTML views, PDF and ePub downloads, according to the available data) and Abstracts Views on Vision4Press platform.
Data correspond to usage on the plateform after 2015. The current usage metrics is available 48-96 hours after online publication and is updated daily on week days.
Initial download of the metrics may take a while.