Fig. 6
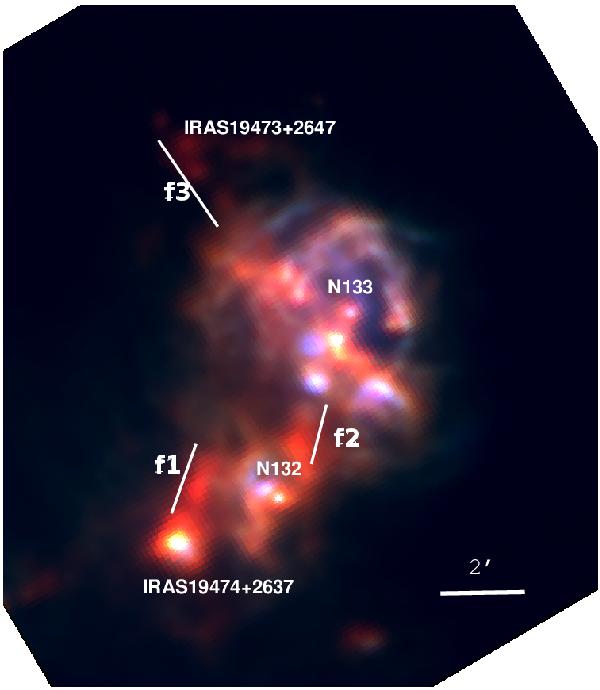
Color-composite image of the Sh2-90 complex at Herschel 350 μm (red), 160 μm (green), and 70 μm (blue) bands centered at α2000 = 19h49m20s, δ2000 = + 26°50′09′′. The positions of the main star-forming sites are also marked (see Fig. 1). The solid lines represent the small filament-like structures (marked as f1, f2, and f3) of the region. North is up and east is to the left.
Current usage metrics show cumulative count of Article Views (full-text article views including HTML views, PDF and ePub downloads, according to the available data) and Abstracts Views on Vision4Press platform.
Data correspond to usage on the plateform after 2015. The current usage metrics is available 48-96 hours after online publication and is updated daily on week days.
Initial download of the metrics may take a while.