Fig. 5
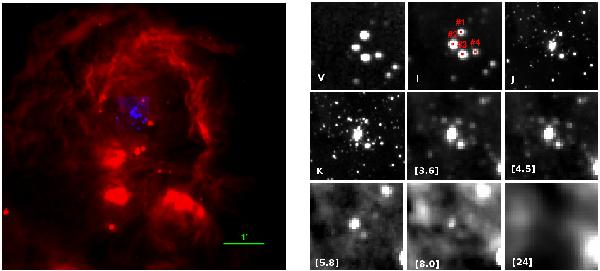
Left: 8.0 μm image (red; from Spitzer-IRAC) centered at α2000 = 19h49m13s, δ2000 = + 26°50′42′′, showing structures pointing to the exciting star candidates shown in R-band image (blue: from DSS2). Right: images showing the exciting star candidates (marked with 1, 2, 3, and 4) at various wavelengths in the range 0.54 to 24 μm (i.e., images at V, I, J, K, 3.6 μm, 4.5 μm, 5.8 μm, 8.0 μm, and 24 μm bands).

Current usage metrics show cumulative count of Article Views (full-text article views including HTML views, PDF and ePub downloads, according to the available data) and Abstracts Views on Vision4Press platform.
Data correspond to usage on the plateform after 2015. The current usage metrics is available 48-96 hours after online publication and is updated daily on week days.
Initial download of the metrics may take a while.