Fig. 21
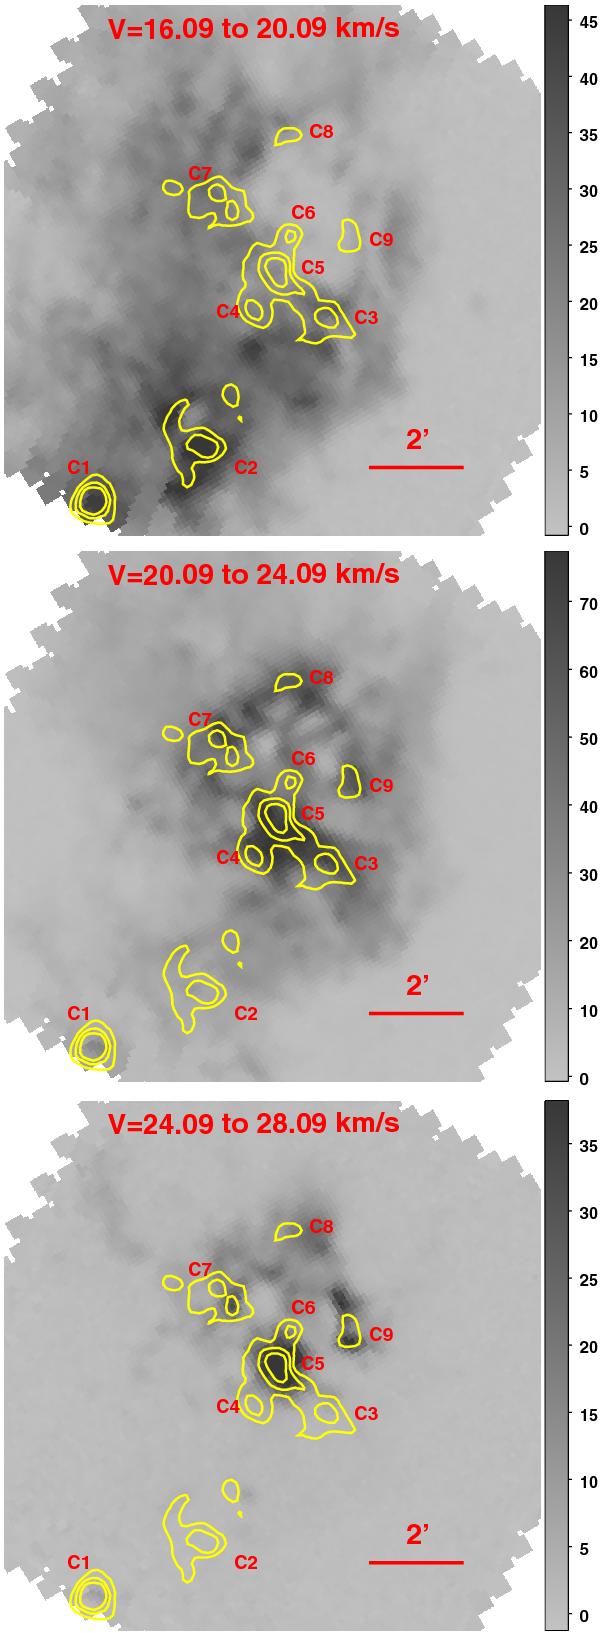
The 12CO(J = 3 − 2) integrated emission in the direction of Sh2-90 centered at α2000 = 19h49m14s, δ2000 = + 26°50′01′′. Velocity ranges are indicated at the top of each image. The horizontal color bars are labeled in units of K km s-1. The data is from Beaumont & Williams (2010). The overlaid 250 μm contours are at 1450, 2000, and 3000 MJy sr-1. The clumps discussed are marked (see also Fig. 12). North is up and east is to the left.
Current usage metrics show cumulative count of Article Views (full-text article views including HTML views, PDF and ePub downloads, according to the available data) and Abstracts Views on Vision4Press platform.
Data correspond to usage on the plateform after 2015. The current usage metrics is available 48-96 hours after online publication and is updated daily on week days.
Initial download of the metrics may take a while.