Fig. 20
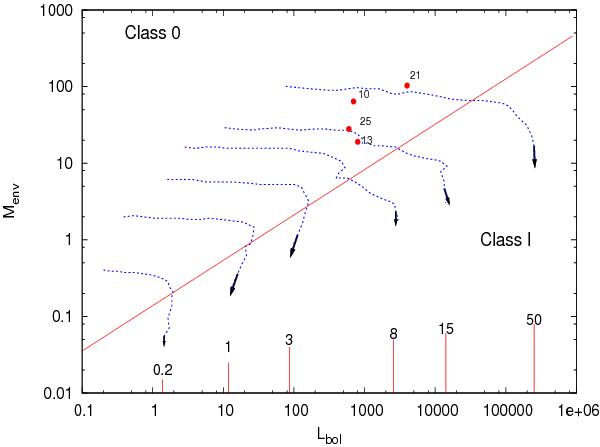
Lbol vs. Menv diagram for the massive YSOs (solid circles with IDs). The dotted blue lines represent the evolutionary tracks from André et al. (2008). Evolution proceeds from the upper left to the lower right (indicated by arrows at the end of each track). The final stellar masses of these tracks in solar units are given above the lower axis. The slanted red line corresponds to the location where 50% of the initial core mass is converted into stellar mass (see Bontemps et al. 1996; André et al. 2000).
Current usage metrics show cumulative count of Article Views (full-text article views including HTML views, PDF and ePub downloads, according to the available data) and Abstracts Views on Vision4Press platform.
Data correspond to usage on the plateform after 2015. The current usage metrics is available 48-96 hours after online publication and is updated daily on week days.
Initial download of the metrics may take a while.