Free Access
Fig. 16
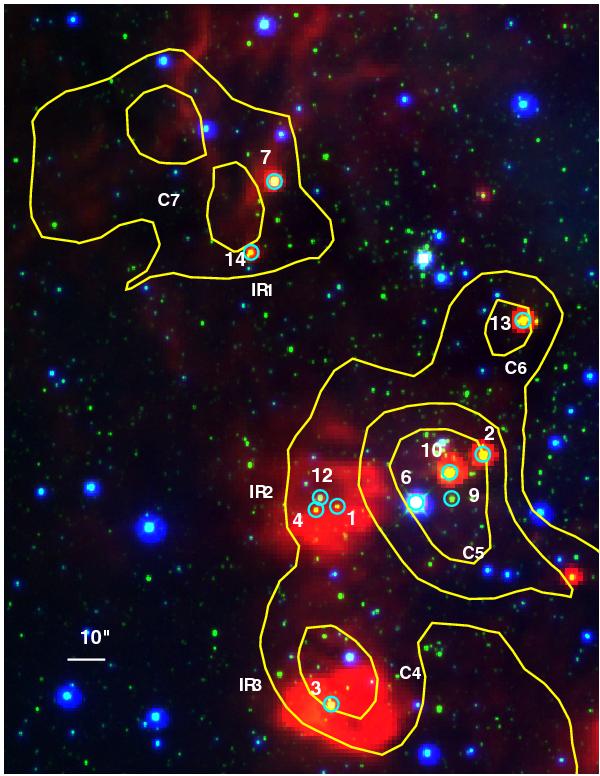
Color-composite image of the regions IR1, IR2, IR3, C5, and C6 at 5.8 μm (red), 2.14 μm (green), and 0.80 μm (blue), with 250 μm contours. The contour levels are at 1450, 2000, and 3000 MJy sr-1. North is up and east is to the left.
Current usage metrics show cumulative count of Article Views (full-text article views including HTML views, PDF and ePub downloads, according to the available data) and Abstracts Views on Vision4Press platform.
Data correspond to usage on the plateform after 2015. The current usage metrics is available 48-96 hours after online publication and is updated daily on week days.
Initial download of the metrics may take a while.