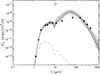
Fig. 14
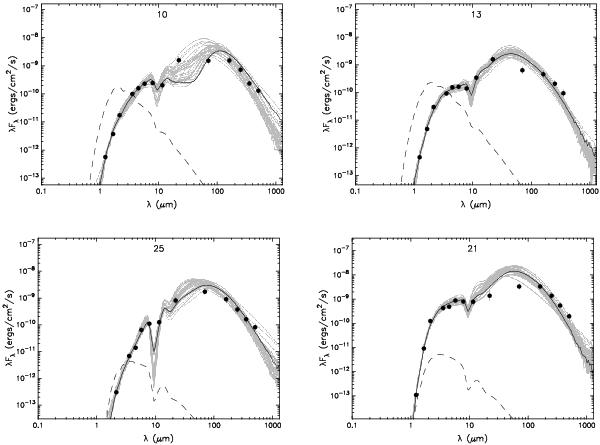
The Robitaille et al. (2007) SED models of the four luminous embedded YSOs in the region (see text). The black line shows the best fit, and the gray lines show subsequent good fits that satisfy  . The adopted flux errors are in the range of 10% to 30%. The dashed line shows the stellar photosphere corresponding to the central source of the best fitting model. The source of adopted flux values at NIR, GLIMPSE, WISE, and Herschel bands is discussed in the text.
Current usage metrics show cumulative count of Article Views (full-text article views including HTML views, PDF and ePub downloads, according to the available data) and Abstracts Views on Vision4Press platform.
Data correspond to usage on the plateform after 2015. The current usage metrics is available 48-96 hours after online publication and is updated daily on week days.
Initial download of the metrics may take a while.