Fig. 13
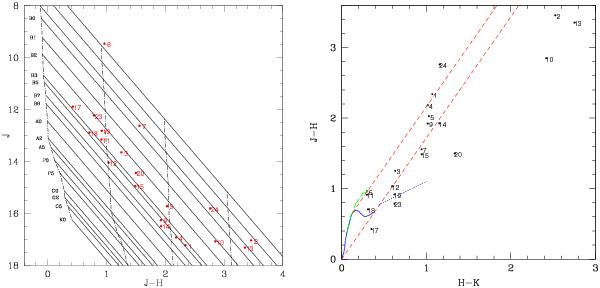
Left: J vs. J − H diagram for luminous sources found within the IR blobs and clumps of the Sh2-90 complex. The ZAMS locus reddened by AV= 0, 10, 20, and 30 mag is shown in vertical dot-dashed lines. Slanting solid lines represent the standard reddening vector drawn from the ZAMS locus corresponding to different spectral types. Right: J − H vs. H − K diagram for the same sources. The thin solid (blue) and thick dashed (green) lines represent the unreddened MS and giant branches (Bessell & Brett 1988), respectively. The dotted line (blue) indicates the intrinsic locus of T-Tauri stars (Meyer et al. 1997). The parallel dashed lines are the reddening vectors drawn from the tip of the giant branch (left reddening line) and from the base of the MS branch (right reddening line). The sources with IDs represent the same sources as in Fig. 12, except source 21 because its colors (J − H = 5.6 mag, H − K = 3.6 mag) fall well beyond the range shown in the plot.
Current usage metrics show cumulative count of Article Views (full-text article views including HTML views, PDF and ePub downloads, according to the available data) and Abstracts Views on Vision4Press platform.
Data correspond to usage on the plateform after 2015. The current usage metrics is available 48-96 hours after online publication and is updated daily on week days.
Initial download of the metrics may take a while.