Fig. 12
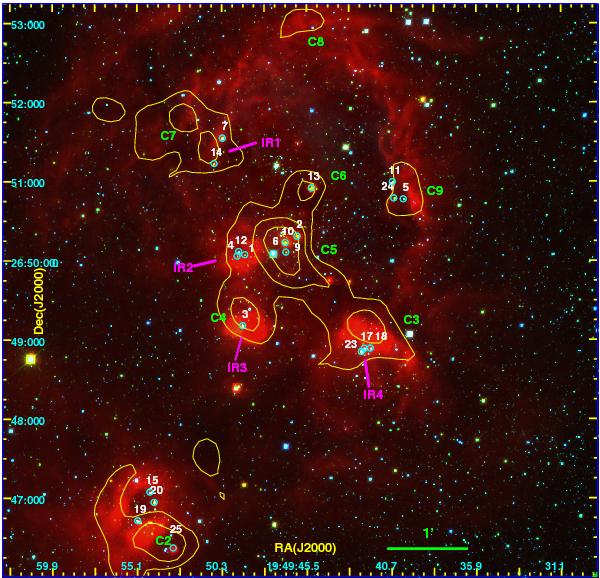
Left: color-composite image of Sh-90 centered at α2000 = 19h49m13sδ2000 = + 26°49′54′′, showing point sources at 1.25 μm (blue), 2.14 μm (green), and 5.8 μm (red). The names refer to the different IR blobs (see Sect. 6.4) and 250 μm clumps (see Sect. 5.3) identified in the complex. The yellow contours represent the 250 μm clumps. The contours are at 1450, 2000, and 3000 MJy sr-1. The small circles mark the position of the NIR sources that lie within these IR blobs and clumps. North is up and east is to the left.
Current usage metrics show cumulative count of Article Views (full-text article views including HTML views, PDF and ePub downloads, according to the available data) and Abstracts Views on Vision4Press platform.
Data correspond to usage on the plateform after 2015. The current usage metrics is available 48-96 hours after online publication and is updated daily on week days.
Initial download of the metrics may take a while.