Fig. 10
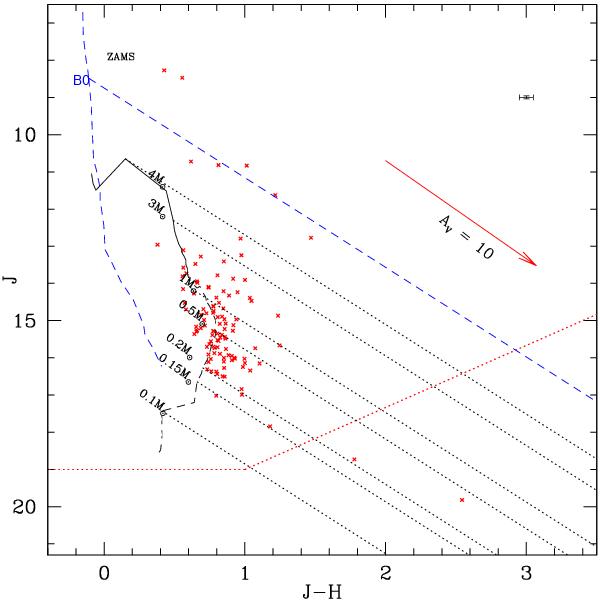
J vs. J − H CM diagram for YSOs of the Sh2-90 complex. The PMS isochrones of 1 Myr from Siess et al. (2000) and Baraffe et al. (1998) are drawn in solid and dashed curved lines (black), respectively, for a distance of 2.0 kpc and zero reddening. The reddening vectors corresponding to 0.1, 0.15, 0.2, 0.5, 1, 3, and 4 M⊙ are drawn in dotted slanting lines. The ZAMS (vertical dashed line in blue), along with the reddening vector (slanted line in blue) from the tip of the B0 star, is also shown. The average error in color is shown on the upper-right side of the figure.
Current usage metrics show cumulative count of Article Views (full-text article views including HTML views, PDF and ePub downloads, according to the available data) and Abstracts Views on Vision4Press platform.
Data correspond to usage on the plateform after 2015. The current usage metrics is available 48-96 hours after online publication and is updated daily on week days.
Initial download of the metrics may take a while.