Fig. 1
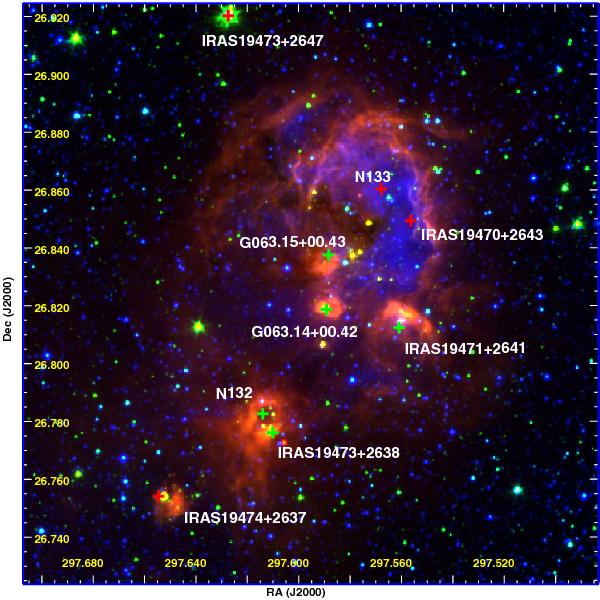
Color-composite image of the Sh2-90 complex. Spitzer-IRAC 8.0 μm (red) and 3.6 μm (green) images have been combined with the DSS2 R-band (blue) image. The different sources associated with the region (see the text) are marked. The field size is 12 0 (E-W) × 120 (N-S), centered at α2000 = 19h49m18s, δ2000 = + 26°49′29′′. North is up and east is to the left.
Current usage metrics show cumulative count of Article Views (full-text article views including HTML views, PDF and ePub downloads, according to the available data) and Abstracts Views on Vision4Press platform.
Data correspond to usage on the plateform after 2015. The current usage metrics is available 48-96 hours after online publication and is updated daily on week days.
Initial download of the metrics may take a while.