Fig. 4
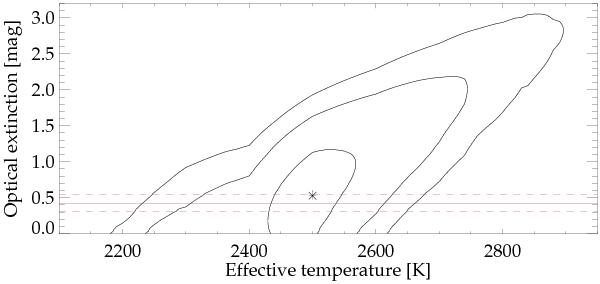
Result of the χ2 minimization analysis for the PZ Tel companion. Plotted are the best value (asterisk) and the 1, 2, and 3σ error contours for effective temperature Teff and optical extinction AV, determined from the comparison of our SINFONI spectrum and the Drift-Phoenix model grid. In addition, the visual extinction of PZ Tel A is shown (horizontal solid brown line), including its 1σ errors (dashed lines) as found by Bailer-Jones (2011).
Current usage metrics show cumulative count of Article Views (full-text article views including HTML views, PDF and ePub downloads, according to the available data) and Abstracts Views on Vision4Press platform.
Data correspond to usage on the plateform after 2015. The current usage metrics is available 48-96 hours after online publication and is updated daily on week days.
Initial download of the metrics may take a while.